Tracking TC Ownership: Descriptive Stats
Introduction
This is the first blog post in a series specifically geared toward exploring the ownership of substance use disorder treatment centers (TCs). I was motivated to start this series when reading Sloan’s chapter (21) in the Handbook of Health Economics which can be found here. I have been reading specifically that chapter of the handbook as I finish some work on a project assessing the impact of a supply shock to the treatment system here in Oregon. At first, I viewed this paper as mostly a straight forward supply shock that would result in a change in admissions to treatment, but as I explored the incentives of the TCs a bit more I believe the question not to be as straight forward. While I was viewing TCs through a more altruistic view — that is, assuming funding TCs would lead to increased admissions in particular for those most at risk — I had not yet looked into how the market structure for health care does not necessarily predict the same thing.
The purpose of today’s post is simply to walk through the motivation for exploring the ownership decision of healthcare firms, and particularly hospitals. I then compare some descriptive statistics for the U.S. and at the state-level of the ownership breakdown of TCs. The eventual idea is to understand if the same problems facing hospitals due to ownership allocation can be applied to TCs.
What do I even mean by the ownership decision? That is the decision for a hospital to be private non-profit, private for-profit or publicly owned.
Sloan explains the motivation for exploring ownership in the context of healthcare as follows:
- Under the view of a firm as a nexus of contracts, the ownership decision is a cost minimizing problem — particularly with respect to transaction costs.
- Health care is no exception, except, the contracts are a bit more complex than the typical firm.
- The product purchaser, i.e. the health services consumer (the patient), is often not the full payor (their marginal cost is lower than the true marginal cost).
- The product purchaser has less information about the products than the suppliers.
- Since the consumer is not the payor, equilibrium determinations are made by comparing the willingness to pay (WTP) of the true payor and the producer, but the payor (e.g. insurance companies) do not reveal their WTP so easily.
- Due to the asymmetric information, hospitals will only provide socially optimal care to the extent they receive direct payment.
- This means that patients with a lower reimbursement rate or high transaction cost could receive less care than those with higher reimbursement rates.
- In other words, the marginal revenue framework of hospitals tells us they are incentivized to treat insured patients.
Social planners know the incentives of hospitals (somewhat) and have created incentives to ensure hospitals provide treatment even to those with low reimbursement rates. One of the most salient examples of this is the provision of charity care by hospitals. Hospitals receive tax breaks for a certain level of charity care provided; property tax at the state level and income tax at the federal level are typical. Note that this doesn’t just apply to hospitals for the most part and extends to any non-profit. For-profit hospitals cannot receive this tax break — a clear example of the sort of ownership-as-a-cost-minimization I was discussing at the beginning.
If you are interested in more of this work, here are three papers I had been reading. I highly recommend reading the one by Chen (2016) for background:
Comparing the Ownership of Hospitals and TCs Nationally
I use data from the AHA Annual Survey from 1999-2023, obtained from KFF to create the following charts and .gifs.
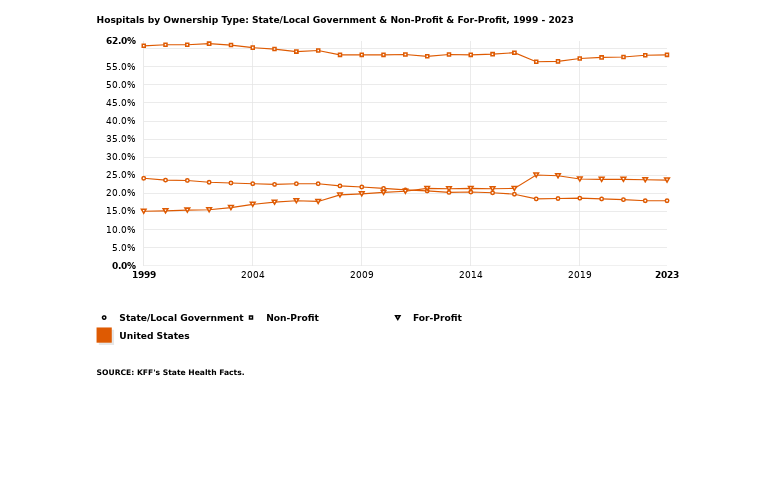
The following is a chart made directly from KFF data on ownership of hospitals:
We can then compare to TC ownership using data from the N-SSATS and N-SUMHSS.1
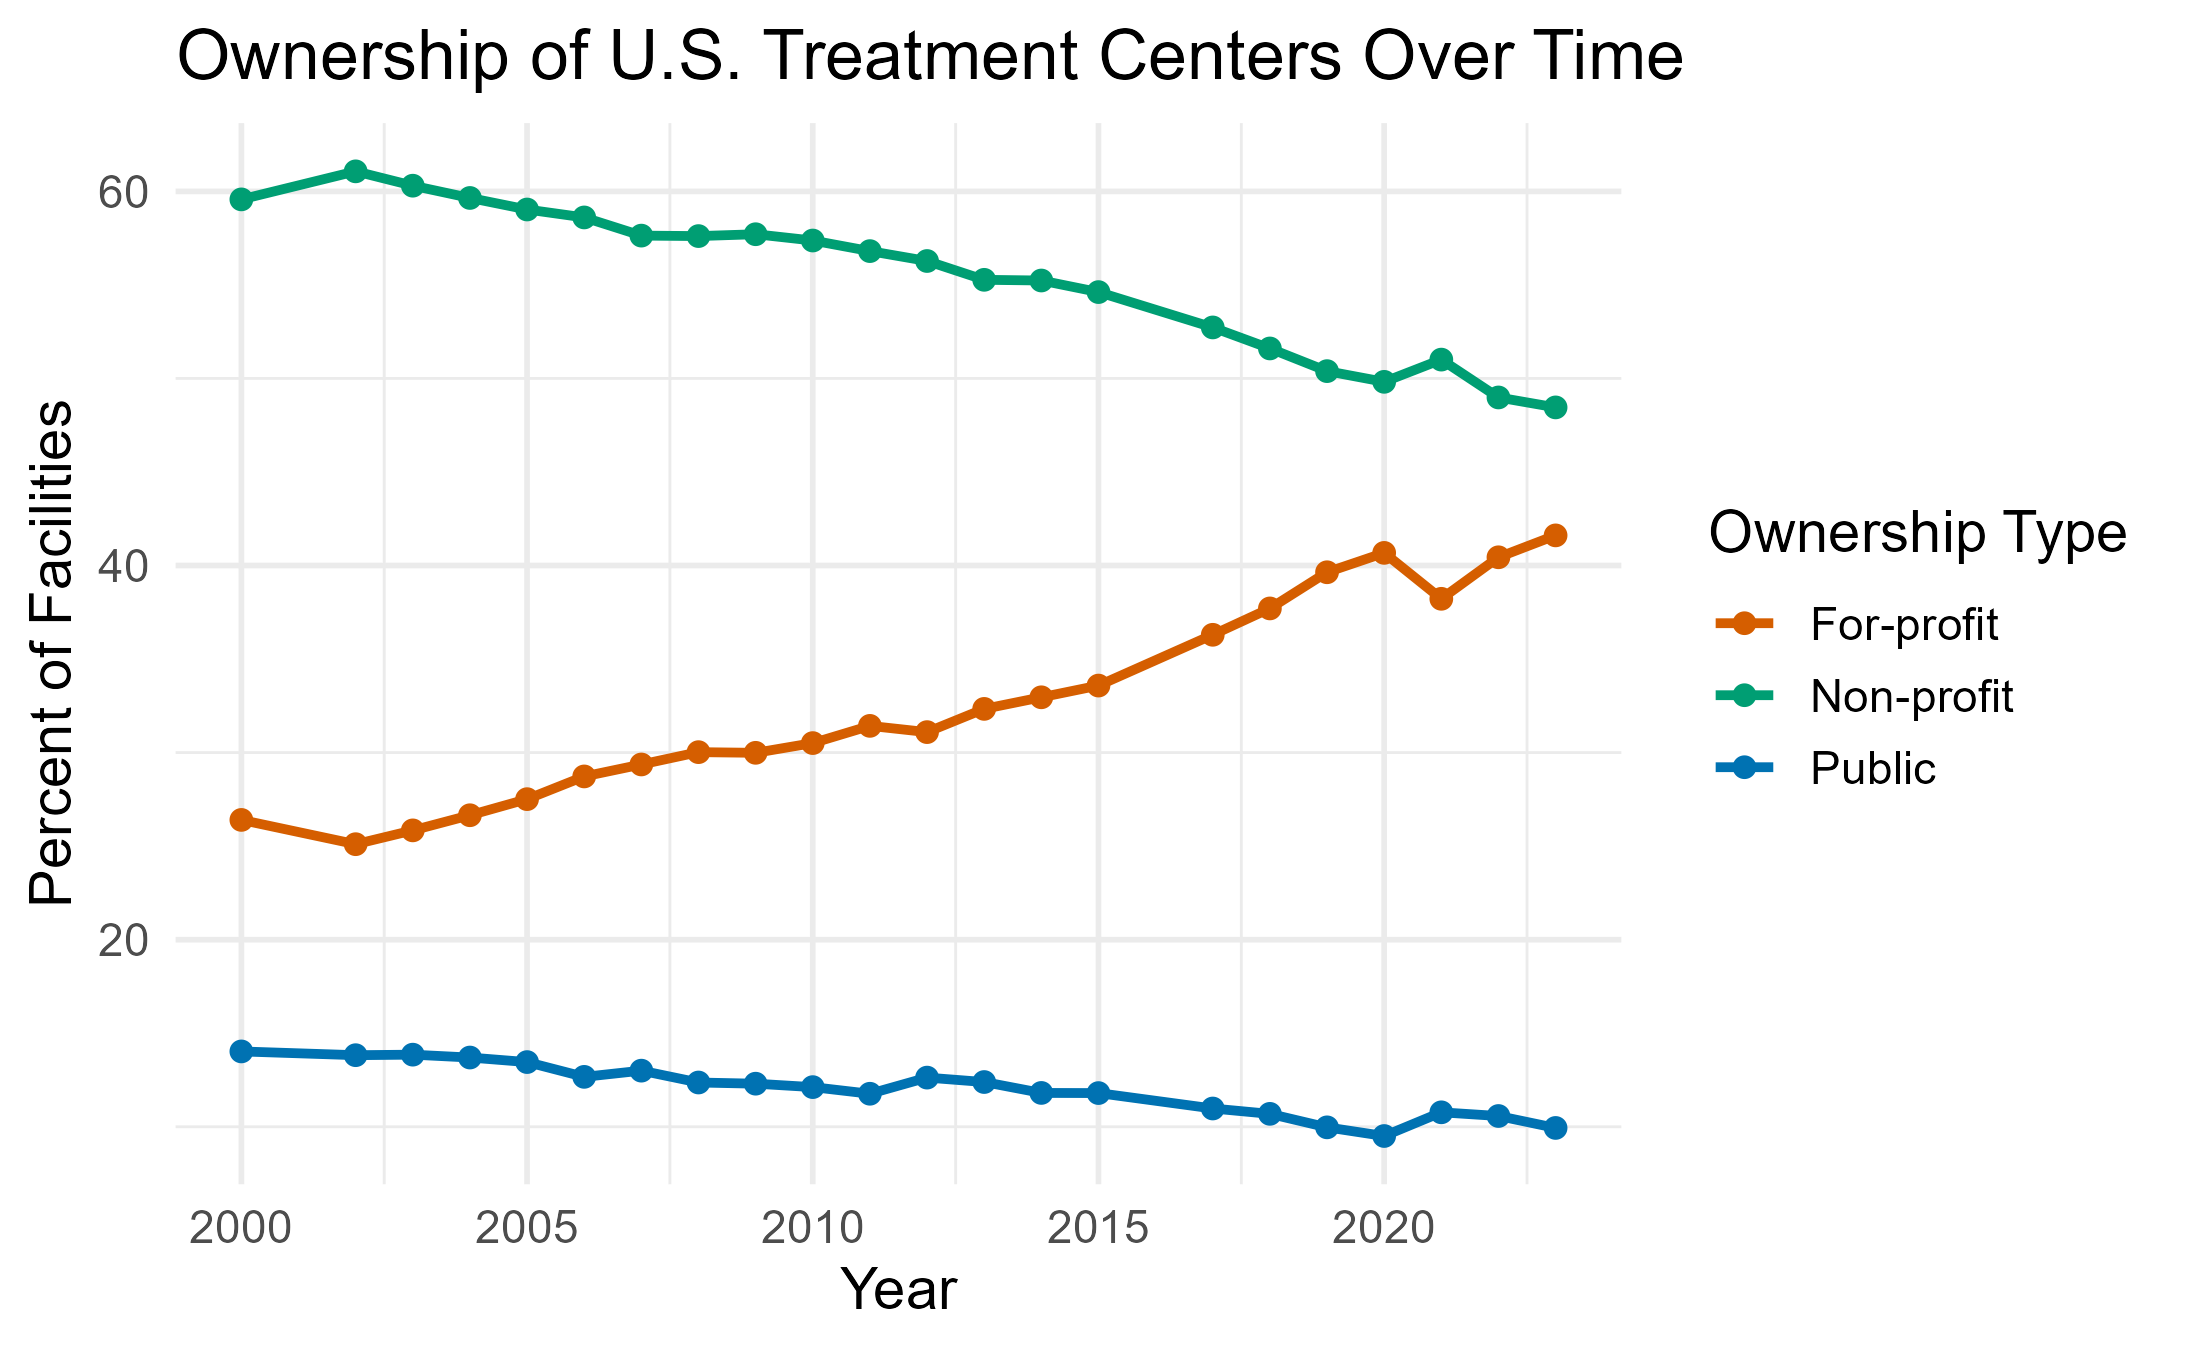
We can note that the non-profit model has been much consistently dominant for hospitals maintaining the majority of the share of hospital ownership from 1999-2023. In contrast, non-profit ownership — while still dominant — has seen a steady decrease annually with for-profit firms starting to take over that share.
Heterogeneity by State
The following maps the by-state heterogeneity across my sample period for TCs on the left and hospitals on the right.
Figure. Ownership shares over time by state (left: Treatment Centers, right: Hospitals).
One thing I notice is some regional heterogeneity; specifically in areas of the South. It might be interesting to explore why that is.
Also, as for some states, they may have very many public hospitals comparatively (e.g. Idaho) but most of their TCs are for-profit.
Going Forward
Much of the empirical literature on hospitals explains why the non-profit form is so dominant, but I can’t quite say that the non-profit form is so dominant among ownership for TCs. For-profit centers are increasing, therefore future posts will consider the profit incentives of a for-profit firm, where they receive most of their funding and what the source of payment (or what they accept) is for the for-profit firm.
In particular, some questions I’ll be answering:
What is the breakdown of services offered across ownership?
Do for-profit TCs offer more revenue-generating services? What are those services?
- Outpatient/residential?
Do for-profits have more decision power in who they admit?
What sort of funding do they receive via revenue (REVCHK in NSSATS/NSUMHSS data) and externally?
- Checking for possible grants, etc.
I’m not going to take these figures as absolute fact. There are many reasons a center has to submit data to SAMHSA for the survey, particularly if they receive state/federal funding of any kind. It may be that for-profits have always been fairly present but were not marked in the data across time. If that is the case, I can discuss ways we might think about instrumenting for the true count of for-profit TCs and discerning whether there is a true rise or not.
Please feel free to DM/email me for comments or questions. The code for this project is available on my Github.
📬 Contact
Footnotes
Note that typically one should not try to compare across N-SSATS and N-SUMHSS as the N-SUMHSS was developed to combine the N-SATSS and N-MHSS and so is not comparable in many ways. In this case, I did restrict the 2021-2023 N-SUMHSS to only TCs, and ownership is a common variable across all years.↩︎