Tracking TC Ownership: Service Type
The Rise in For-Profits: Why?
The last two posts of this series have outlined two descriptive facts among the substance use treatment center market.
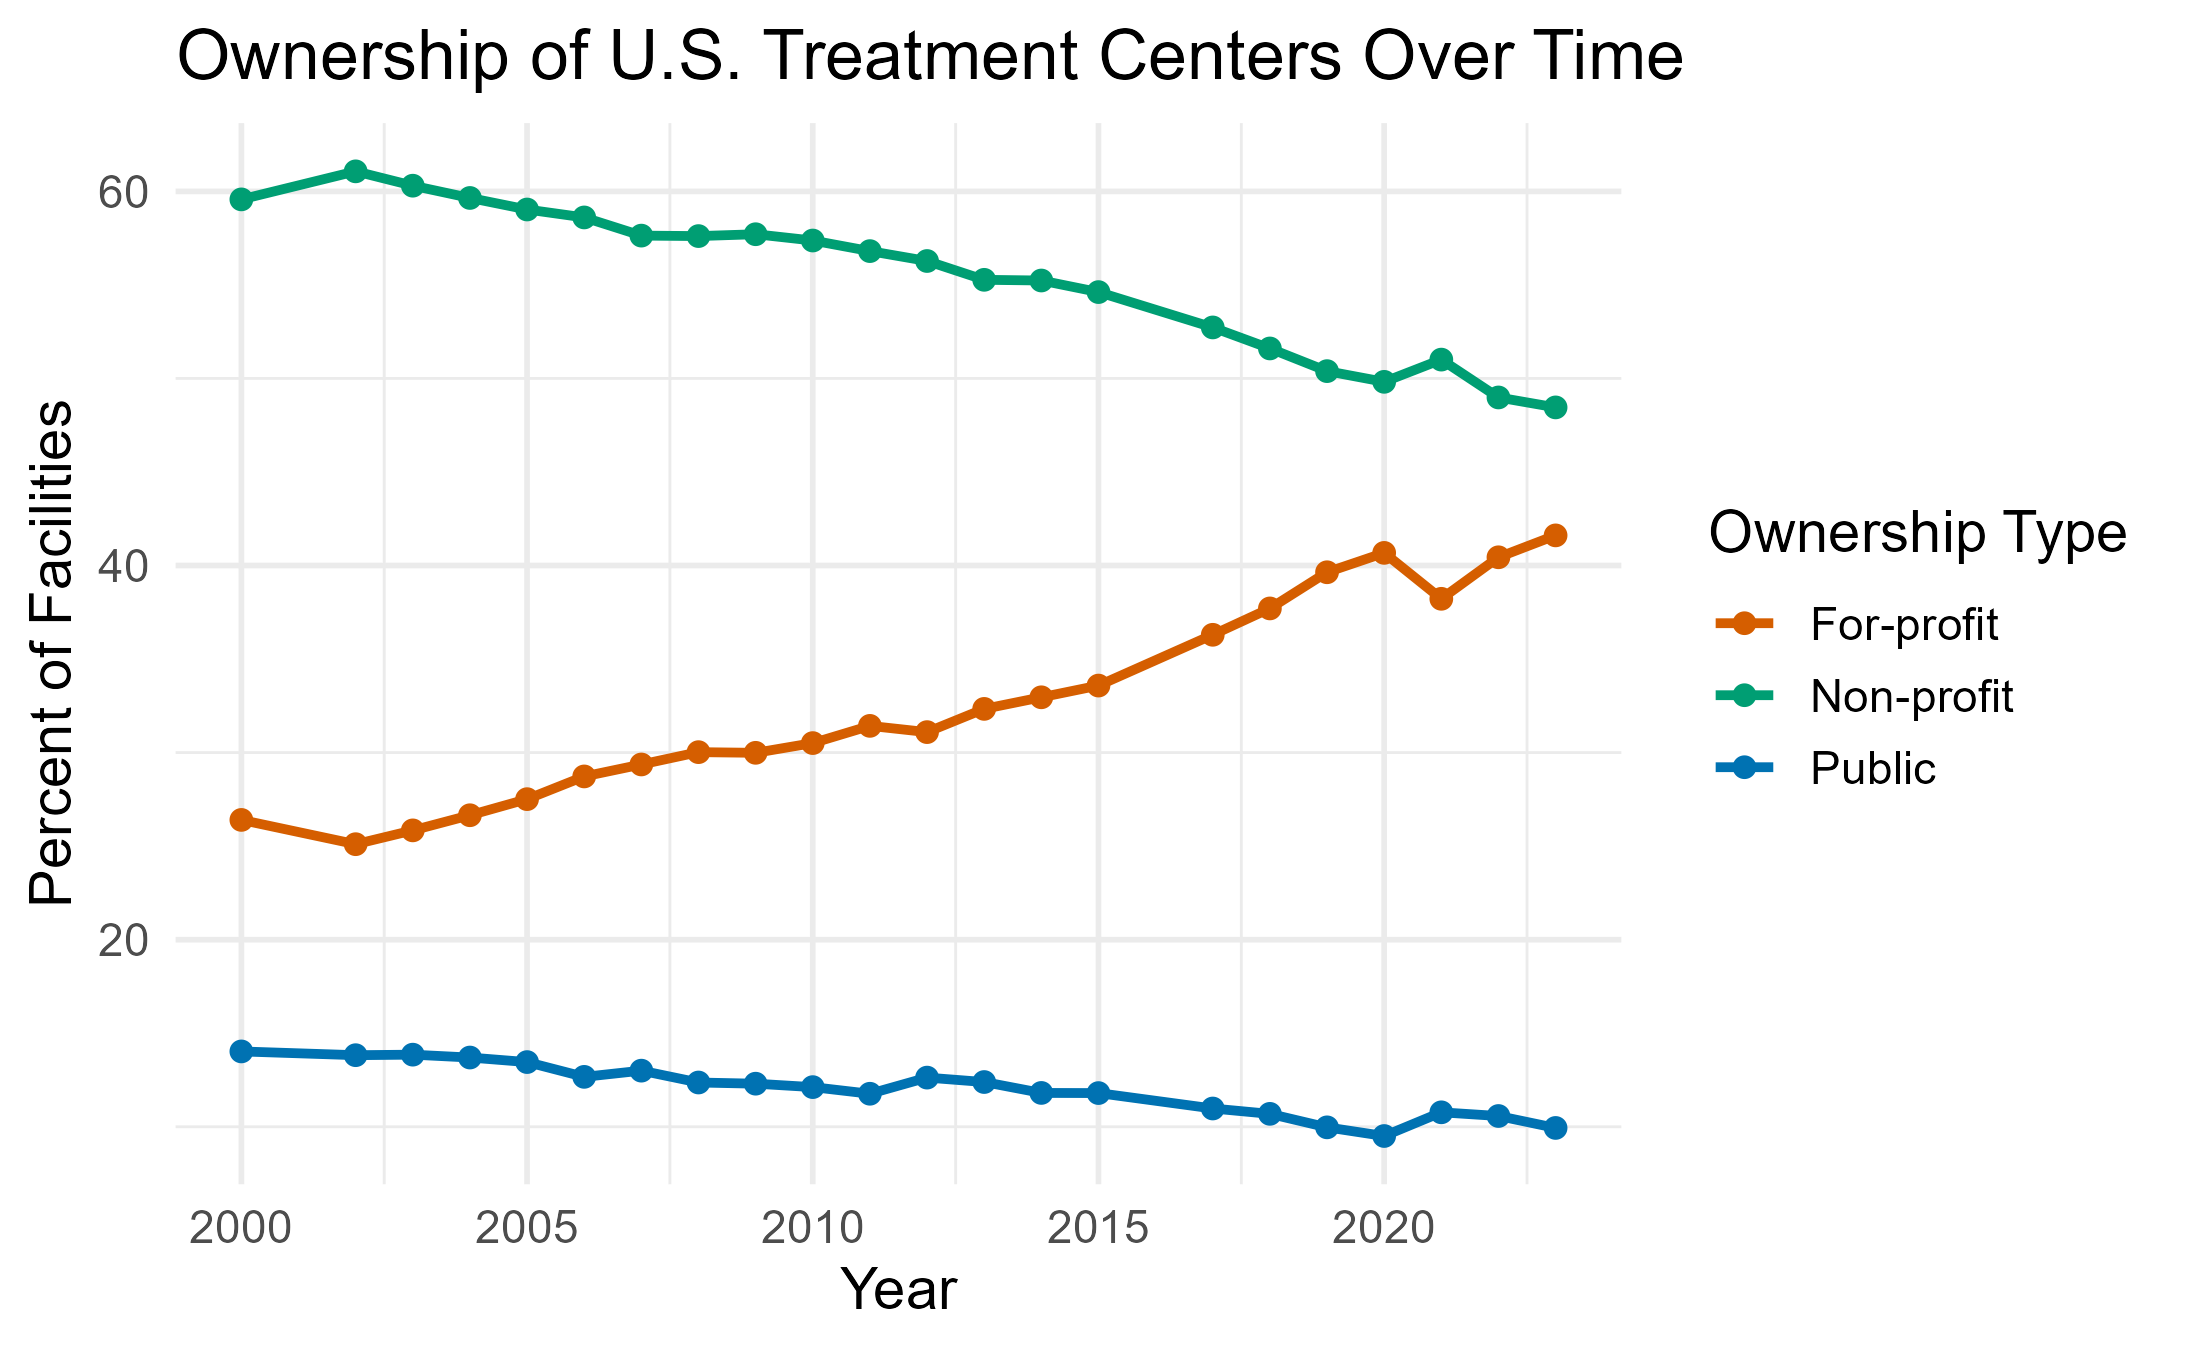
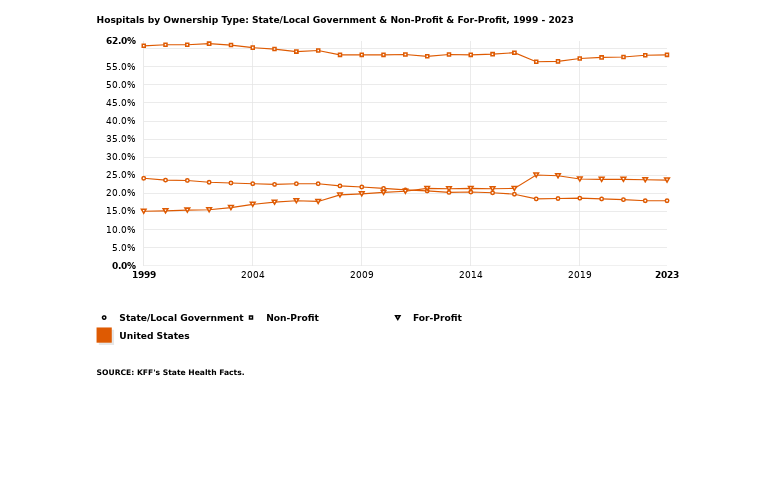
- In the first post, I showed that U.S. treatment centers have become increasingly for-profit centric. Using data from the N-SSATS (and N-SUMHSS with the caveat that I am not supposed to assume that I can compare the two) I showed how the ownership makeup from the year 2000 onward has gone from only around 25% for-profit to over 40%. While the share of public TCs over time has decreased, it seems to do so at a less drastic rate indicating that public TCs have not opened up over time. The ownership status of for-profits and non-profits seem to be inverses of each other, on the other hand. This is not the case in other medical fields such as mental health or hospitals, therefore there is something substance use specific.
- One of my initial thoughts was that the payment accepted by these for-profit treatment centers may be different than that of the non-profit TCs. The charts show similar responsiveness to the acceptance of different payment types across time, which is in line with much of the health economic literature. We see that, regardless of ownership, firms respond similarly to each other. One of the more notable gaps was in the acceptance of public insurance.

Today, I explore differences in the care settings of treatment centers across time. The motivation behind this is twofold. Since for-profits have an objective function of profit-maximizing, and non-profits consider quality, we may see differences in care settings assuming quality differences across those setting. For instance, if outpatient TCs are of less quality than residential centers, we may see non-profits move towards that. I mention quality because many of the models of non-profit hospitals use quality as another part of the objective function; I discussed the Newhouse model specifically in this post. We can think of this lens as more of an entry-exit decision by TCs.
The other motivation is a substitution decision. This has been briefly studied in the hospital literature, but theoretical models do not tend to match up well with substitution behavior. What I mean by substitution behavior is a firm entering as one ownership type and changing over time. Cutler and Horwitz in the Handbook of Economics are just one example. For his part, Sloan dedicates part 6 of his chapter in the handbook and a paper or two.
That being said, and as Sloan notes, understanding why a firm switches — and better yet, the marginal social value of switching — is “far from a trivial task.” So today, I only hope to show some descriptives that might indicate that we are seeing switching behavior in the TC market and reflect on possible mechanisms.
TC Switching?
I use data from the N-SSATS (2000-2020) and the N-SUMHSS (after 2020). The original purpose of the exercise was just to determine if for-profit TCs tend to gravitate toward particular services, and since the care setting would tend to alter the services offered (something I actually haven’t looked into but just assume), I can answer the question looking at the ownership share by setting. What I found was a similar pattern to overall TCs of a rise in for-profit ownership across all care settings.


What I assumed I would find was that for-profit centers tended to offer residential services. Those are the high-revenue specialty services that I would think for-profits would tend to. I was thinking of the almost spa-like retreat centers celebrities go to. Instead, I found that most residential treatment centers are non-profits, and that the ownership share for for-profits was highest among inpatient and outpatient centers.
In retrospect, since residential facilities involve such long stays patients might want to ensure they have a quality stay. Being a high quality uncertainty industry, non-profits may have a comparative advantage in residential treatment. I also imagine that residential treatment programs are high-cost since they offer round-the-clock care and wraparound services. There is not enough revenue potential for a for-profit center. Furthermore, an entity planning to open a residential center may prefer to open as a non-profit due to the property tax incentives of the non-profit. If they provide enough charity care, they receive both income and often property tax exemption. We might also expect variation by states that have more strict exemption policies since the property tax exemption is not mandatory.

Inpatient shares being higher for for-profits in the long run makes sense with the slight rise in for-profit hospital ownership. They actually seem to be pretty co-linear.
 What I found most likely was the rise in outpatient centers owned for-profit. This makes quite a bit of sense to me: outpatient centers are not run all day and are therefore low-cost to operate, when I think of outpatient I think of medication so the billing is ensured by insurance for the most part meaning high reimbursement rates, and you do not need much land for an outpatient center. In fact, I am most surprised that the rise was only recent. This raises the speculative possibility that some pre-2011 for-profit outpatient facilities may have functioned in ways resembling “pill mills.”
Now that I notice it though, could it be that the for-profit TCs that existed prior to the reformulation were doing outpatient treatment mostly focused on distributing Oxycontin, then switched to other types of treatment later? Note the rise in residential and inpatient shares, while not stark certainly have a different path after the reformulation in 2011. Someone should look into that. OK I will. I suppose this could also be an ACA effect passing, so we would want to account for that in the analysis.
Final Thoughts
Regardless, the inverse relationship of for-profit and non-profit shares across care setting have me thinking there may be some substitution behavior going on across the board. What is driving this is yet unknown. The descriptives of this question still need work since I never actually identified switches but rather changes in share which could also be due to differences in effort to build brick and mortar centers.
The start of my academic term is coming up and I am teaching EC-320. I am working on developing replication projects for them to do this term which will be up on my GitHub and likely this site. The next goal I have for this series/area of work I’ve been focusing on is to combine the N-SSATS better. Right now we only have a concatenated file for 1997-2011 which makes cleaning extremely difficult. Hoping to have that done sometime this term.